Debugging Guide
Debugging is a crucial and frequent task during plugin development. Currently, two debugging solutions are provided: Qt Creator-based and GDB command line. Developers can choose the appropriate debugging solution based on their requirements.
Prerequisites for Qt Creator-based plugin debugging:
- Qt Creator and AuboStudio must be installed in the same development environment.
- The plugin must be loaded into the AuboStudio software.
Prerequisites for GDB-based plugin debugging:
- The plugin must be loaded into the AuboStudio software.
Plugin Development and Debugging Strategies Based on Qt Creator
Plugin Output Path Configuration
After installing the AuboStudio software package, the software will generate an arcs_ws folder in the root (or home) directory. The arcs_ws folder serves as the workspace for AuboStudio. Plugins must be loaded into AuboStudio's working directory to run, therefore when building executable plugins, the output path of target properties should be set in the arcs_ws folder.
Taking the plugin myplugin as an example, set the following content in myplugin's CMakeLists.txt:
# Set plugin output path
set(PLUGIN_OUTPUT_PATH $ENV{HOME}/arcs_ws/extension)

# Build plugin that can be loaded in aubo_scope
add_libary(myplugin SHARED
	${_srcs}
	${install_src}
	${program_src}
	)
set_target_properties(myplugin PROPERTIES
	LABELS aubo_caps
	OUTPUT_NAME myplugin
	PREFIX ""
	DEBUG_POSTFIX ""
	LIBRARY_OUTPUT_DIRECTORY ${PLUGIN_OUTPUT_PATH}/myplugin
	CXX_VISIBILITY_PRESET hidden
)
注意
- When generating the
myplugindynamic library file, users need to configure the${_srcs},${install_src}, and${program_src}files as required. - When setting the properties of the generated
myplugin, it is only necessary to focus on configuring the target path forLIBRARY_OUTPUT_DIRECTORY. Other properties can be set as needed.
Plugin Project Compilation Configuration
When Qt Creator and AuboStudio are installed in the same development environment, modify the plugin project's run configuration to update the plugin content under arcs_ws directly during compilation and run the AuboStudio software for convenient debugging.
Using the myplugin plugin as an example, here's the detailed configuration method:
Open Qt Creator and open the myplugin plugin project.
Click "Projects" in the left menu bar, click "Projects > Run", and configure the following items:
- Active Project: Select the plugin project (myplugin).
- Run Configuration: Add a new run configuration by clicking "Add..." on the right side.
- Executable: Set this path to the location of the AuboStudio executable file. By default, AuboStudio is installed under
/opt/arcs.
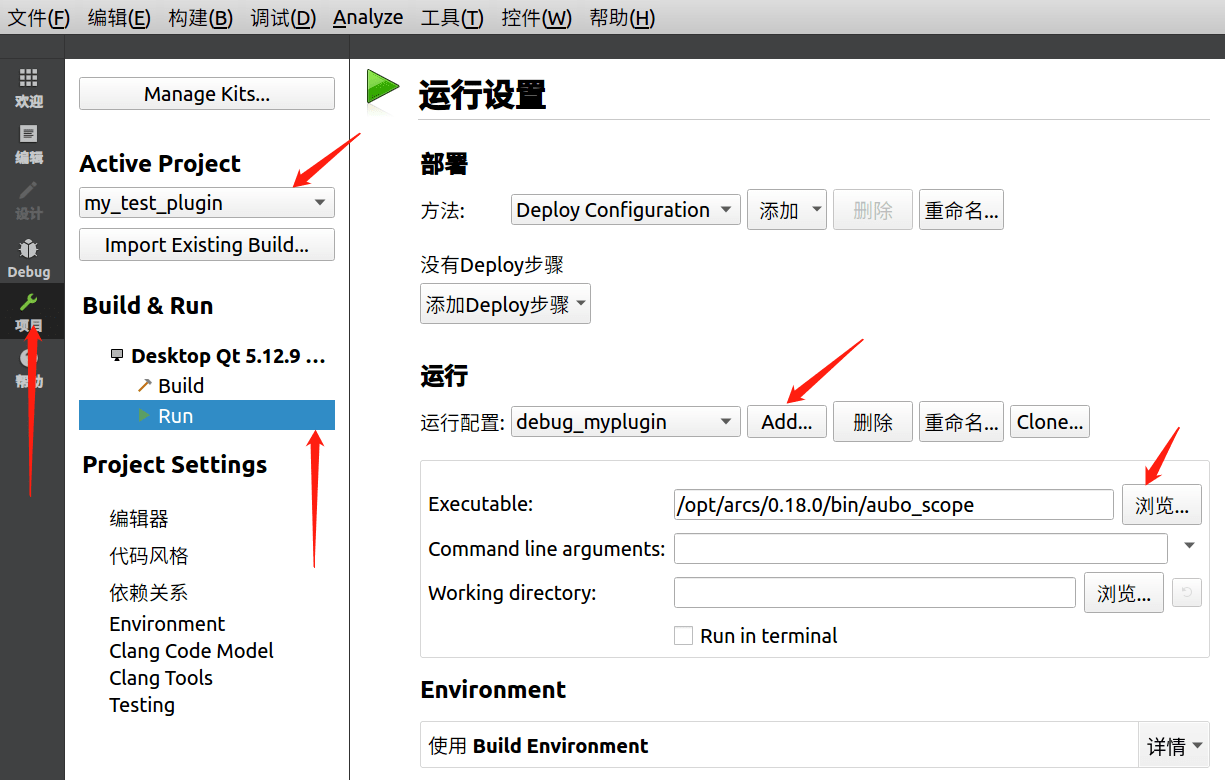
Main concept: Modify the plugin project's run configuration so that when compiling the plugin project, it directly updates the plugin content under
arcs_wsand runsaubo_scopefor debugging convenience.Specific configuration: (using
mypluginas an example)Open
qtcreatorand open our plugin project.Select Projects in the left menu bar, click
run. Configure the following options in this interface:Active Project: Select the plugin project.Run Configuration: Add a new run configuration by clicking
addon the right side.Executable: Set this path to the location of theaubo_scopeexecutable file. By default,arcsis installed under/opt/arcs.
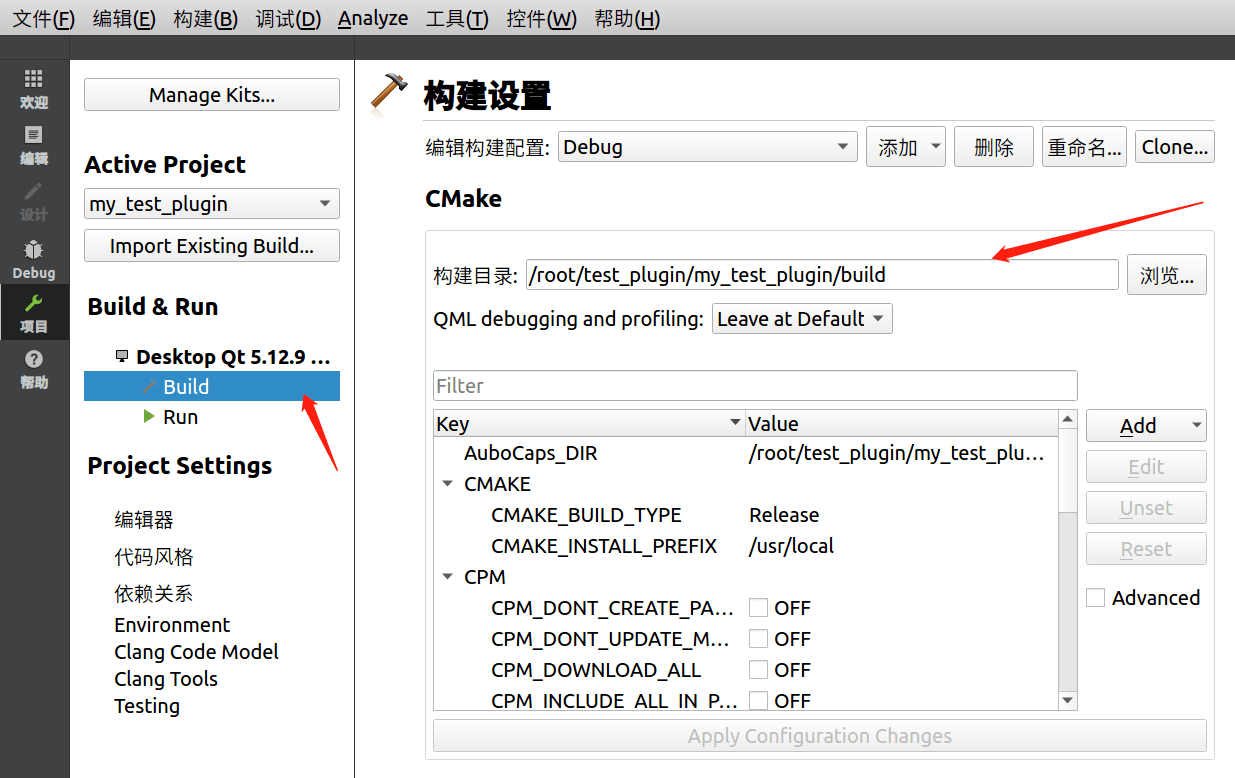
(Recommended modification) Customize the [Build] path, typically set to the [build] directory.
Qt Creator Debugging Process
Open Qt Creator and open the myplugin project.
Click on "Debug" at the bottom of the left menu bar, select the configured option, then compile the plugin project to begin debugging the plugin.
- If multiple run configurations have been set up for this plugin, you need to select the
aubo_scopeconfiguration that was just set up (renamed here asdebug_myplugin).
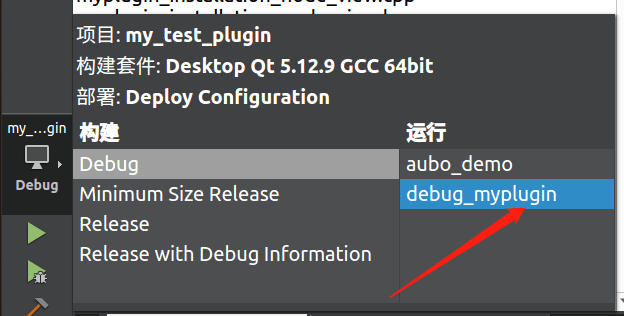
- If multiple run configurations have been set up for this plugin, you need to select the
The compilation and running results of the plugin are shown below:
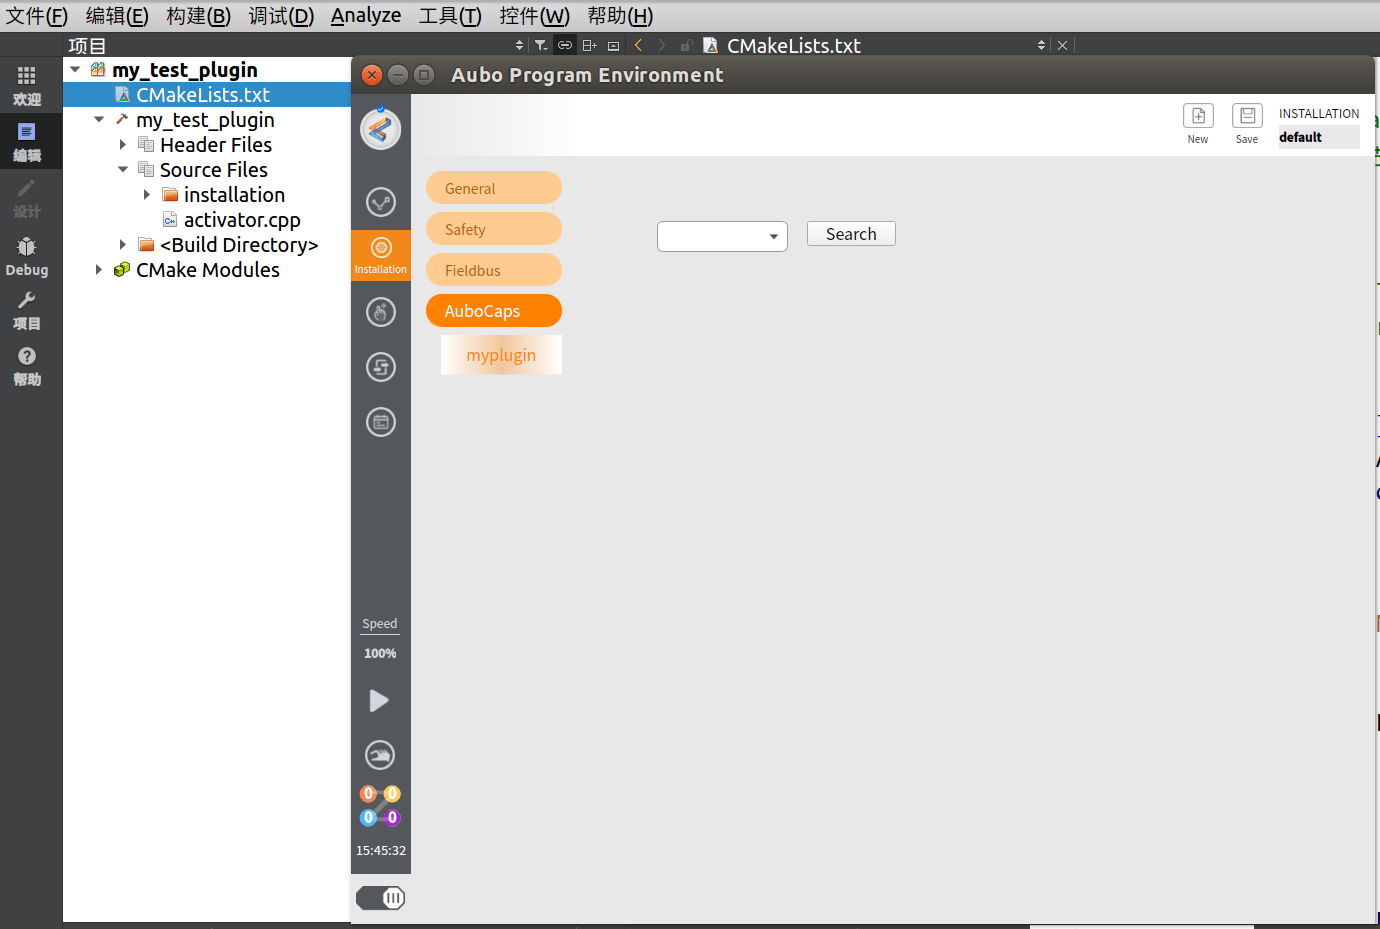
Plugin Development and Debugging Strategies Based on Qt Creator GDB
Set Plugin Output Path
Similar to the Qt Creator debugging approach, when building runnable plugins, set the output path of the target properties under the arcs_ws folder to automatically update the plugin dynamic library files in the arcs_ws folder after updating the plugin source code.
Taking the plugin myplugin as an example, set the following content in myplugin's [CMakeLists.txt]:
# Set the plugin output path
set(PLUGIN_OUTPUT_PATH $ENV{HOME}/arcs_ws/extension)

# Build plugins that can be loaded in aubo_scope
add_libary(myplugin SHARED
	${_srcs}
	${install_src}
	${program_src}
	)
set_target_properties(myplugin PROPERTIES
	LABELS aubo_caps
	OUTPUT_NAME myplugin
	PREFIX ""
	DEBUG_POSTFIX ""
	LIBRARY_OUTPUT_DIRECTORY ${PLUGIN_OUTPUT_PATH}/myplugin
	CXX_VISIBILITY_PRESET hidden
)
注意
- When generating the
myplugindynamic library file, users need to configure the${_srcs},${install_src}, and${program_src}files according to their requirements. - When setting the properties of the generated
myplugin, here you only need to focus on setting theLIBRARY_OUTPUT_DIRECTORYtarget path. Other properties can be configured as needed.
GDB Debugging Process
Navigate to the root directory of the plugin project and execute the following commands to compile the plugin source code:
bashmkdir -p build cd build cmake -DCMAKE_BUILD_TYPE=Debug.. make -j`nproc`注意
Ensure that the
debuginformation is retained (i.e.,cmake -DCMAKE_BUILD_TYPE=Debug ..). Otherwise, after launching AuboStudio, setting breakpoints in the plugin source code will not allow you to step into the plugin's dynamic library code.Launch AuboStudio under GDB:
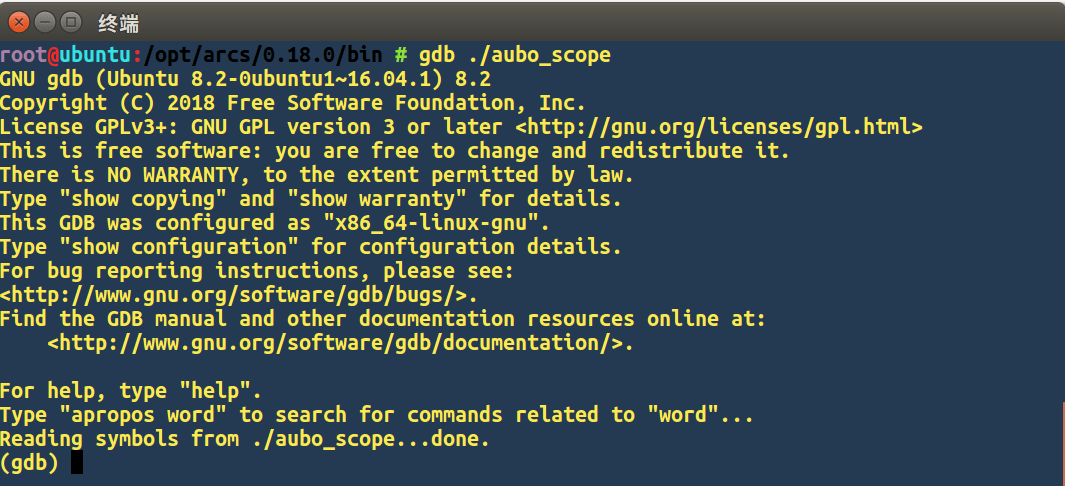
bashcd /opt/arcs/0.18.0/bin gdb ./aubo_scope注意
The default installation path for AuboStudio is under
/opt/arcs. If multiple versions of AuboStudio are installed, you need to select the appropriate version first, then navigate to itsbindirectory to locate theaubo_scopeexecutable file (in this case, version 0.18.0 is used).If the launch is successful, the following message will appear:
gdbReading symbols from ./aubo_scope...done.Set breakpoints in the plugin source code and debug the plugin. You can directly use the
breakcommand to set breakpoints for debugging.
Below is a simple debugging process using the plugin myplugin as an example:
Compile the
mypluginsource code.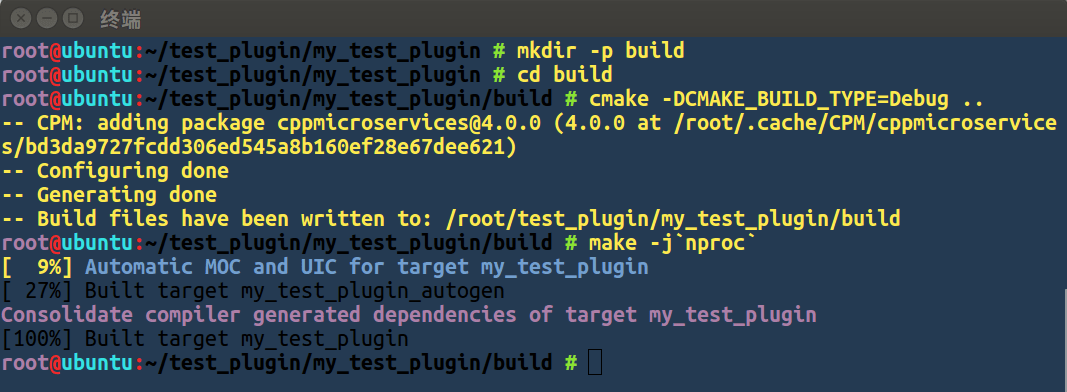
Launch GDB.
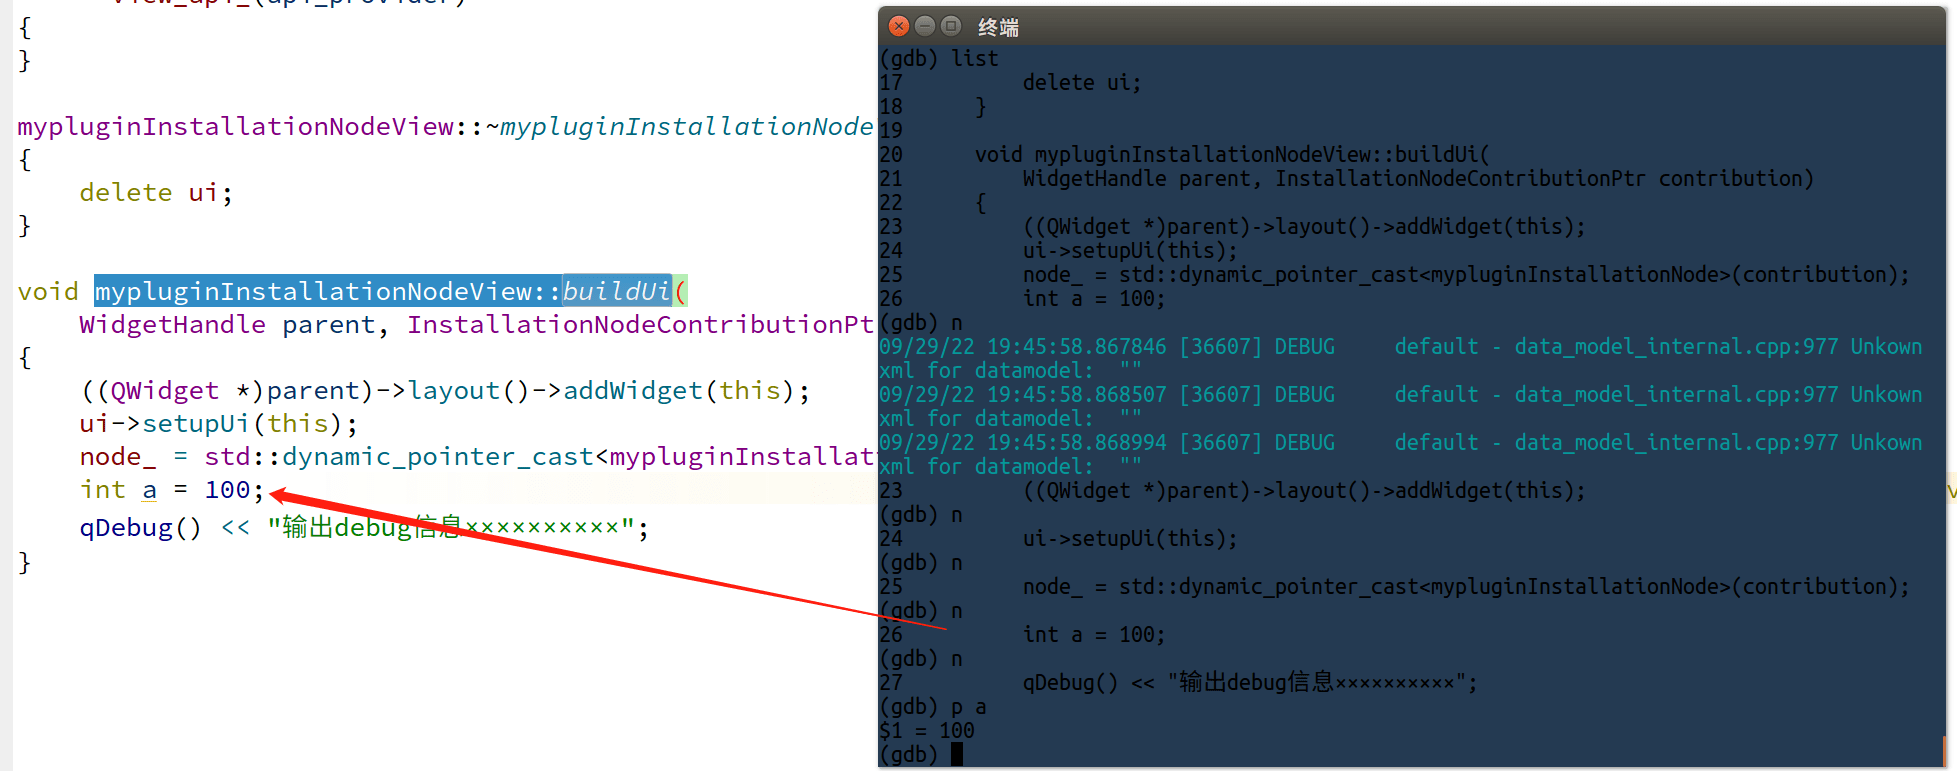
Set breakpoints. The breakpoint location is shown in the figure below.
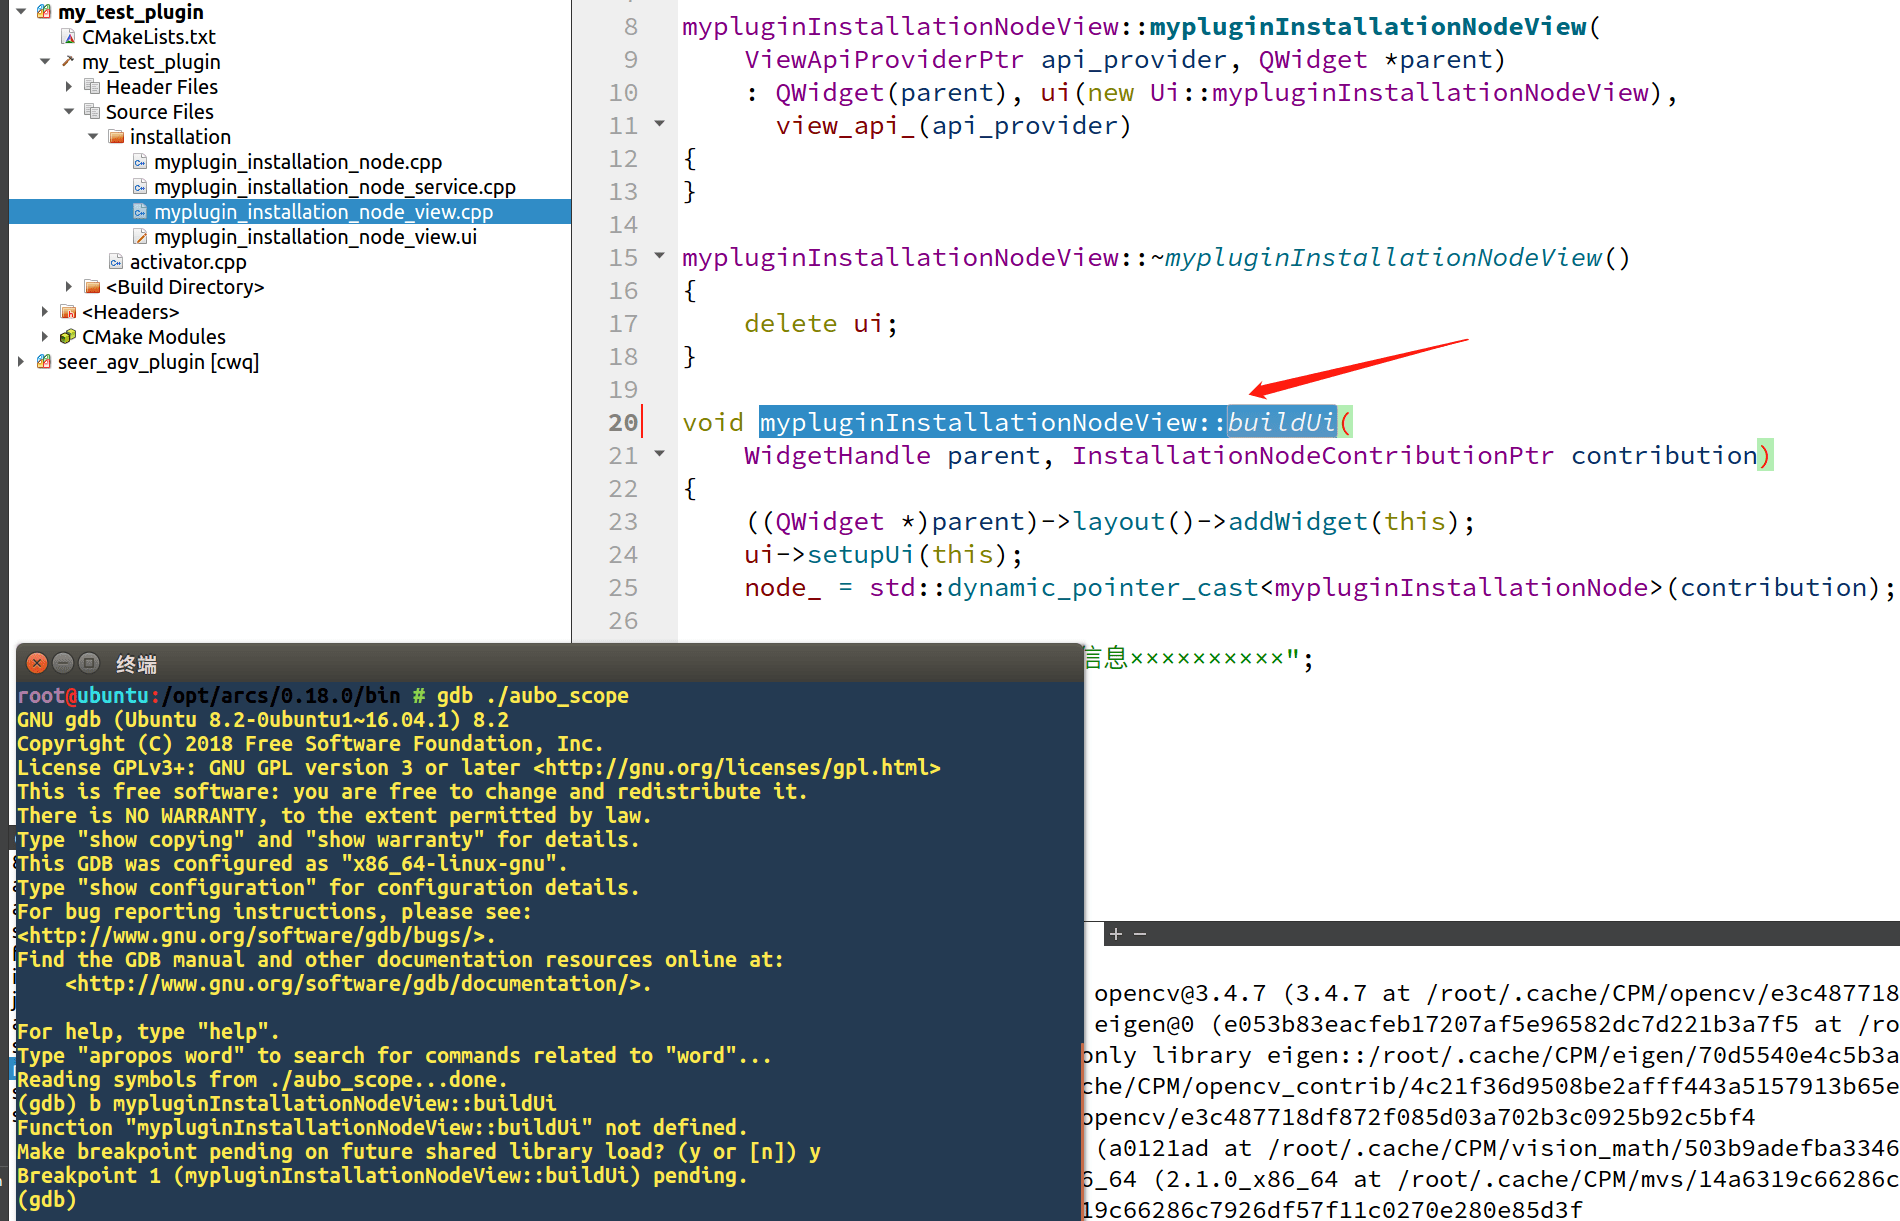
View the source code at the breakpoint. You can use the
listcommand to view the source code in the current stack frame. By default, it displays 10 lines.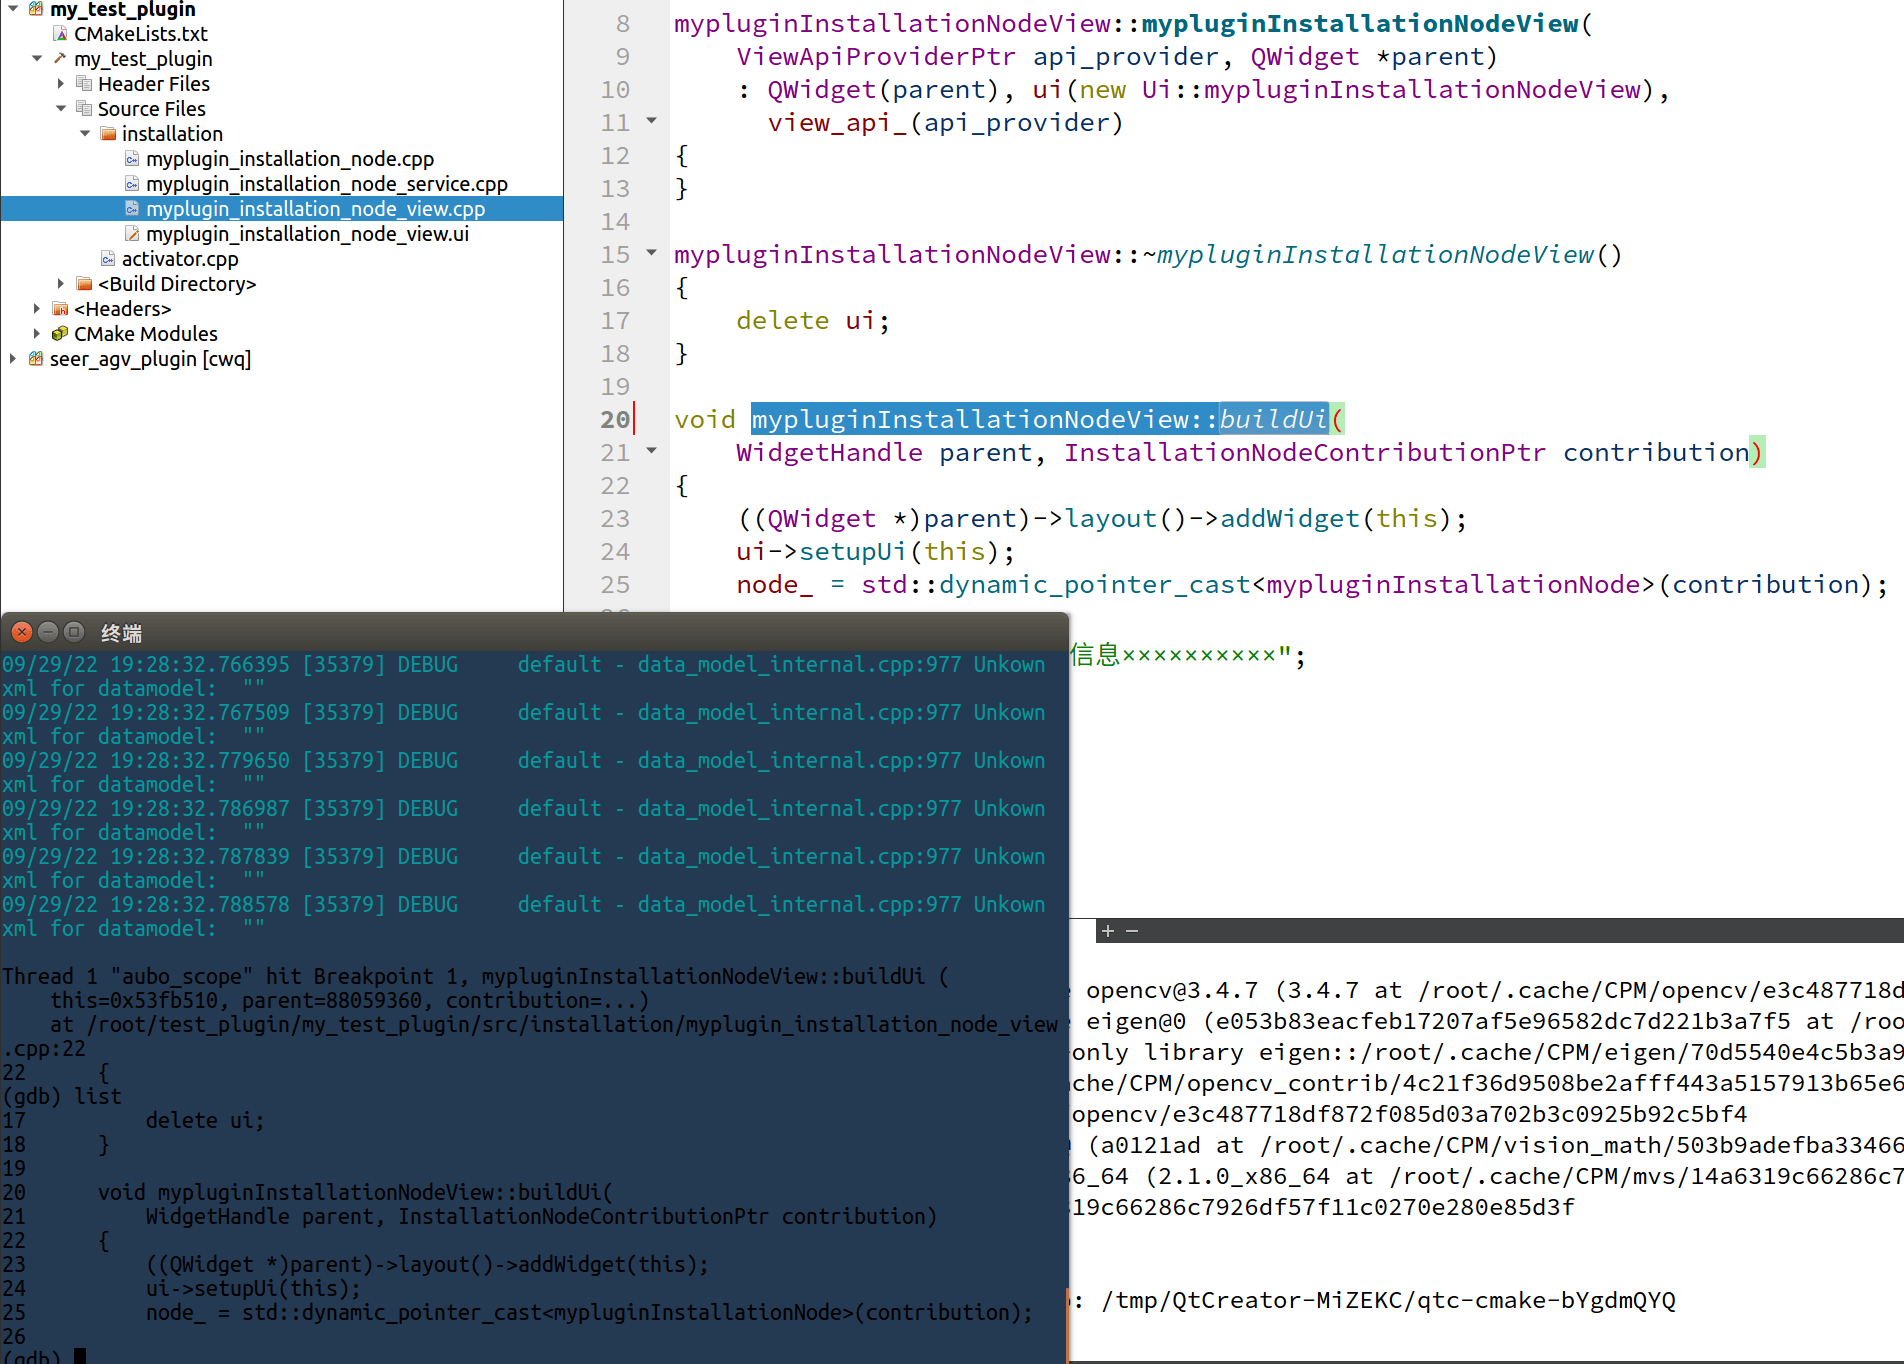
Inspect variable values. Use the step command
bto run the program to the lineint a = 100, and then use thepcommand to check the value ofa.