Troubleshooting Teach Pendant Software Freezes
Locally, try to access the terminal. Press Ctrl+Alt+F1 to enter the terminal, using the username root and password bestcobot; exit the terminal with Ctrl+Alt+F7.
Remotely, log in to the target device via ssh, with password bestcobot.
1. UI Popup Focus Conflict
Condition 1: The UI is frozen and the screen turns gray-black.
Cause: The UI is frozen.
Solution: No special action is required. Wait about 15 seconds, and the teach pendant will automatically end the process and restart.
Condition 2: The UI is frozen for a long time and the screen does not turn gray-black.
Cause: The interface cannot be operated due to a focus conflict. This usually occurs when there are many popup windows.
Solution: Plug a keyboard into the control cabinet and press 【Alt】+【Tab】 to view or switch popup windows. If the problem persists, power off and restart the system.
2. top/htop Commands
Purpose: A performance analysis tool that displays the resource usage of each process in the system in real time.
top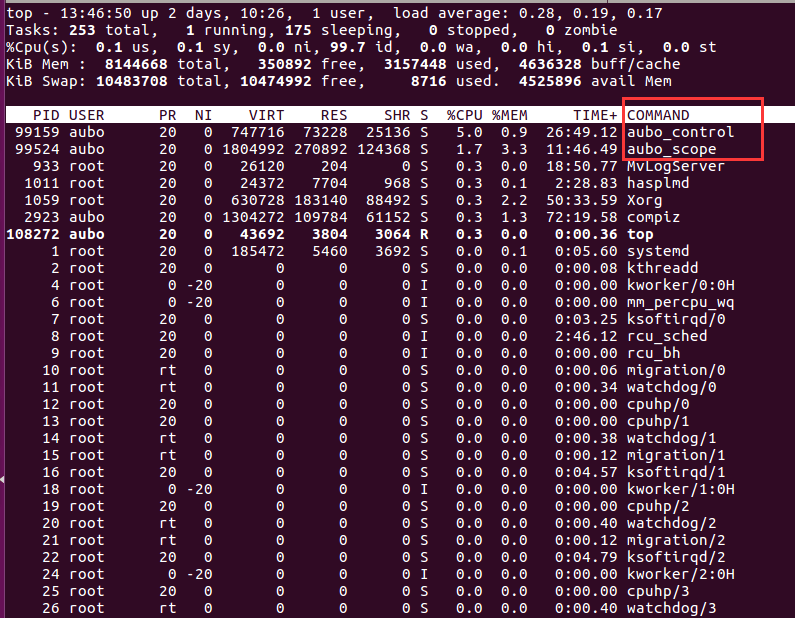
The output can be roughly divided into 7 parts:
- Line 1 shows the system overview.
- Line 2 shows the process overview.
- Line 3 shows the CPU overview.
- Line 4 shows the memory overview.
- Line 5 shows the Swap partition overview.
- Line 6 is an empty line used to display the parameters entered when running the command.
- The remaining part shows the detailed information of each process.
htop -p `pgrep aubo_scope`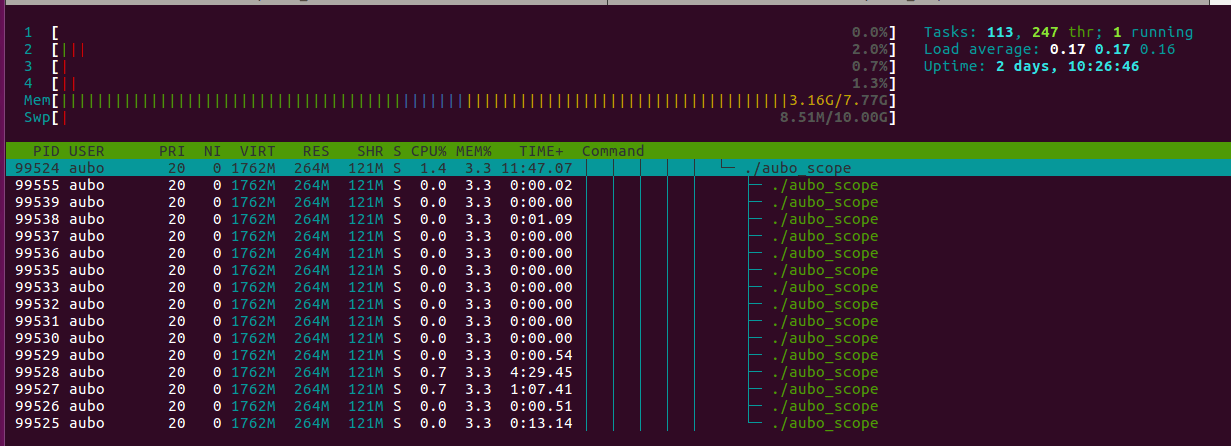
htop -p `pgrep aubo_control`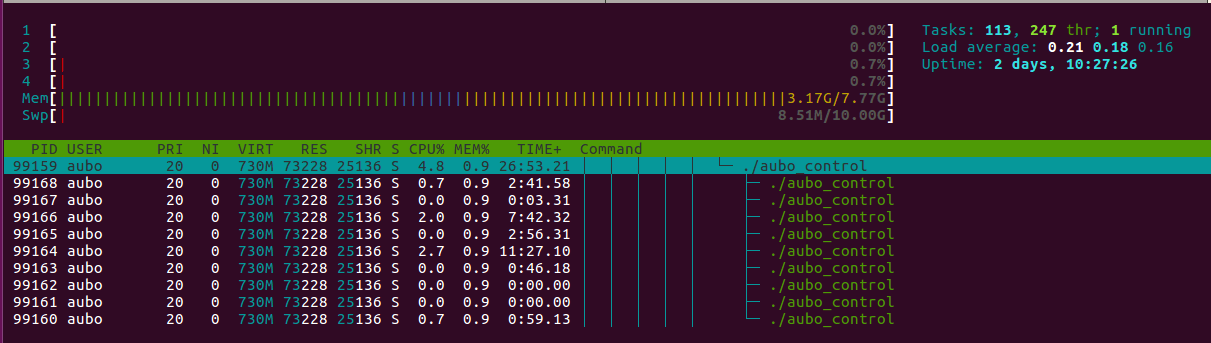
3. strace Command
Purpose: The strace command is a tool that integrates diagnosis, debugging, and statistics, and can be used to trace and debug programs.
Example: Suppose the CPU usage of aubo_control reaches 100% after running, and then returns to normal after a while. After executing the strace -c -p command, when the time you care about has arrived, press Ctrl + c to exit; strace will then list the following related information.
strace -c -p `pgrep aubo_control`- -c: Count the time, calls, and errors of each system call, and report a summary.
- -p: Trace the process with process ID PID; can be repeated.
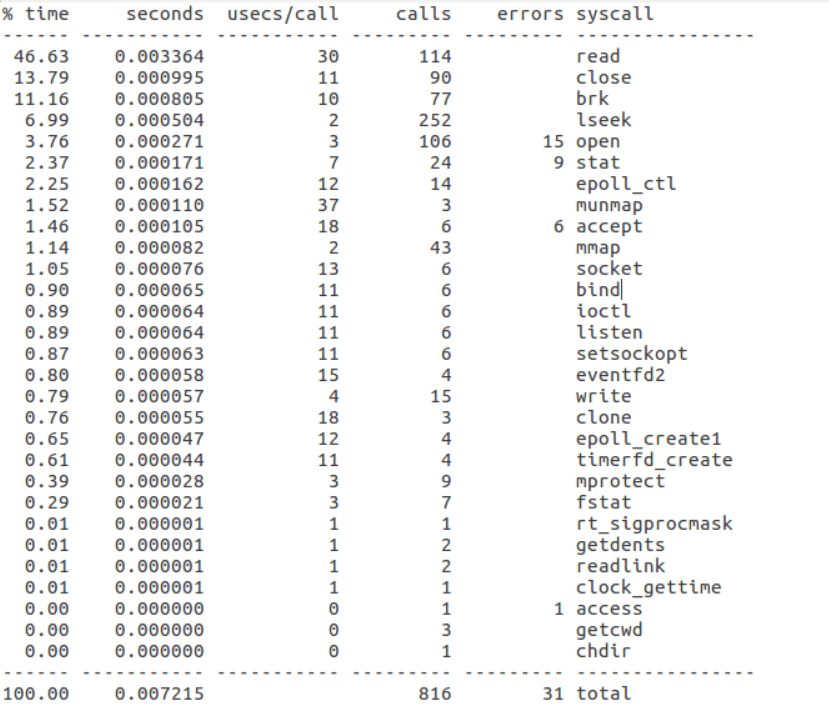
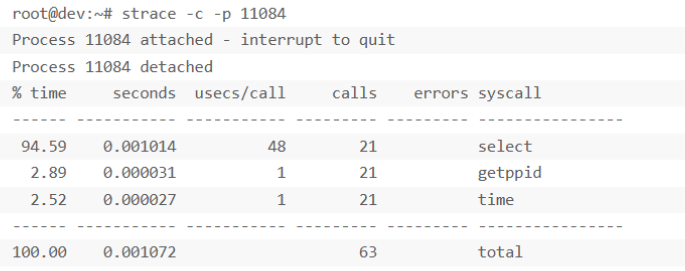
In the screenshots above, the program spent most of its time waiting on select(), and each select() call invoked getppid() and time(), which is a typical event loop.
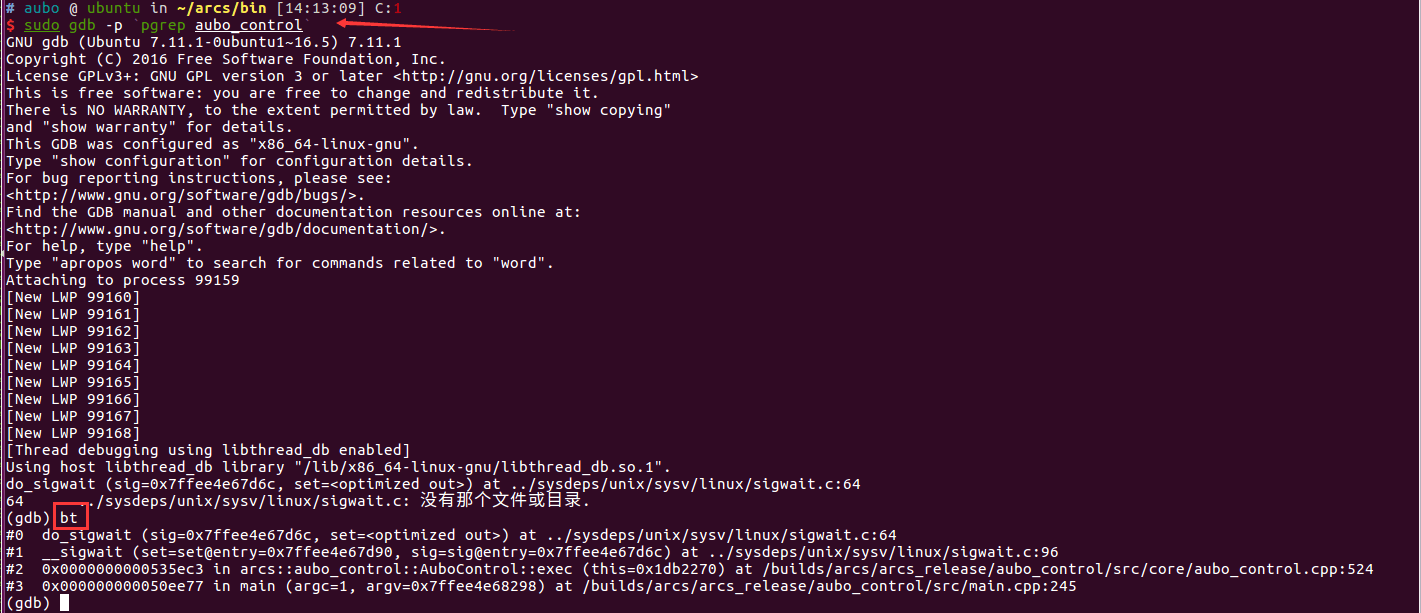
4. gdb Command
Purpose: View the stack information of a program.
Common gdb commands:
gdb -p `pgrep aubo_control`- l: Display source code.
- bt: View stack information.
- i: View information.
- n: Execute the next statement.
- r: Run the program.
- p: Print a variable value, e.g.
p sumprints the value of the variable sum. - q: Quit the gdb debugger.